Valuations of IP and intangible assets are complex and often unintuitive. Purchase price allocations (“PPAs”) or stand-alone IP valuations require esoteric financial models, hypothetical assumptions, and speculative projections. It is often difficult to gain comfort with a 50-100-page bespoke valuation report. Studying PPAs reported by public companies to the SEC may help.
We analyzed 3,000+ PPAs reported since 2015 across such industries as technology, healthcare, consumer, financial services, and industrials. This database can be accessed at bench805.com.
A few takeaways are:
-
- PPA benchmarks can strongly support PPA valuations.
- A narrow industry sector helps define the allocation; a broad industry category does not.
- Valuation of one intangible asset may depend on the existence of another.
- A few good benchmarks are better than 20 less comparable ones.
- Median valuations or useful lives can be highly misleading.
Benchmarking by Industry
PPA benchmarking is a useful way to learn about the types of intangibles recognized, their relative valuations, and the amount of purchase consideration allocated to goodwill. In the table below, we compare broad information technology and biopharmaceutical PPAs. For example, information technology acquisitions often include a significant amount of goodwill (50%), biopharma acquisitions often include substantial in-process R&D (55%), and consumer products acquisitions often include elevated trade name valuations (~10%).
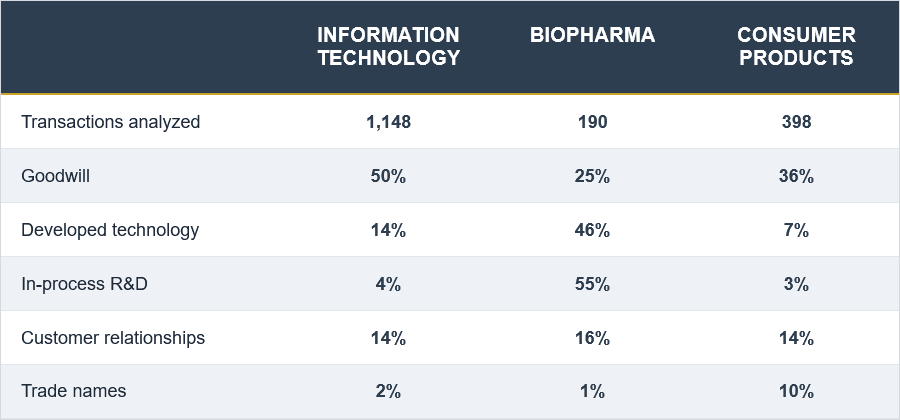 (Percentage of Total Assets Acquired)
Benchmarking by Sector
Industry category can be too broad to identify meaningful PPA patterns. It is more critical to limit the PPA benchmarks to how the company conducts its business. Hardware and software companies’ PPA differs more than that of two software companies that provide services in different industries.
Below are comparisons between the PPA benchmarking for the blended technology industry and for more narrowly defined industry segments such as E-Commerce, Electronic Equipment, IT Consulting, IT Hardware, and Software.
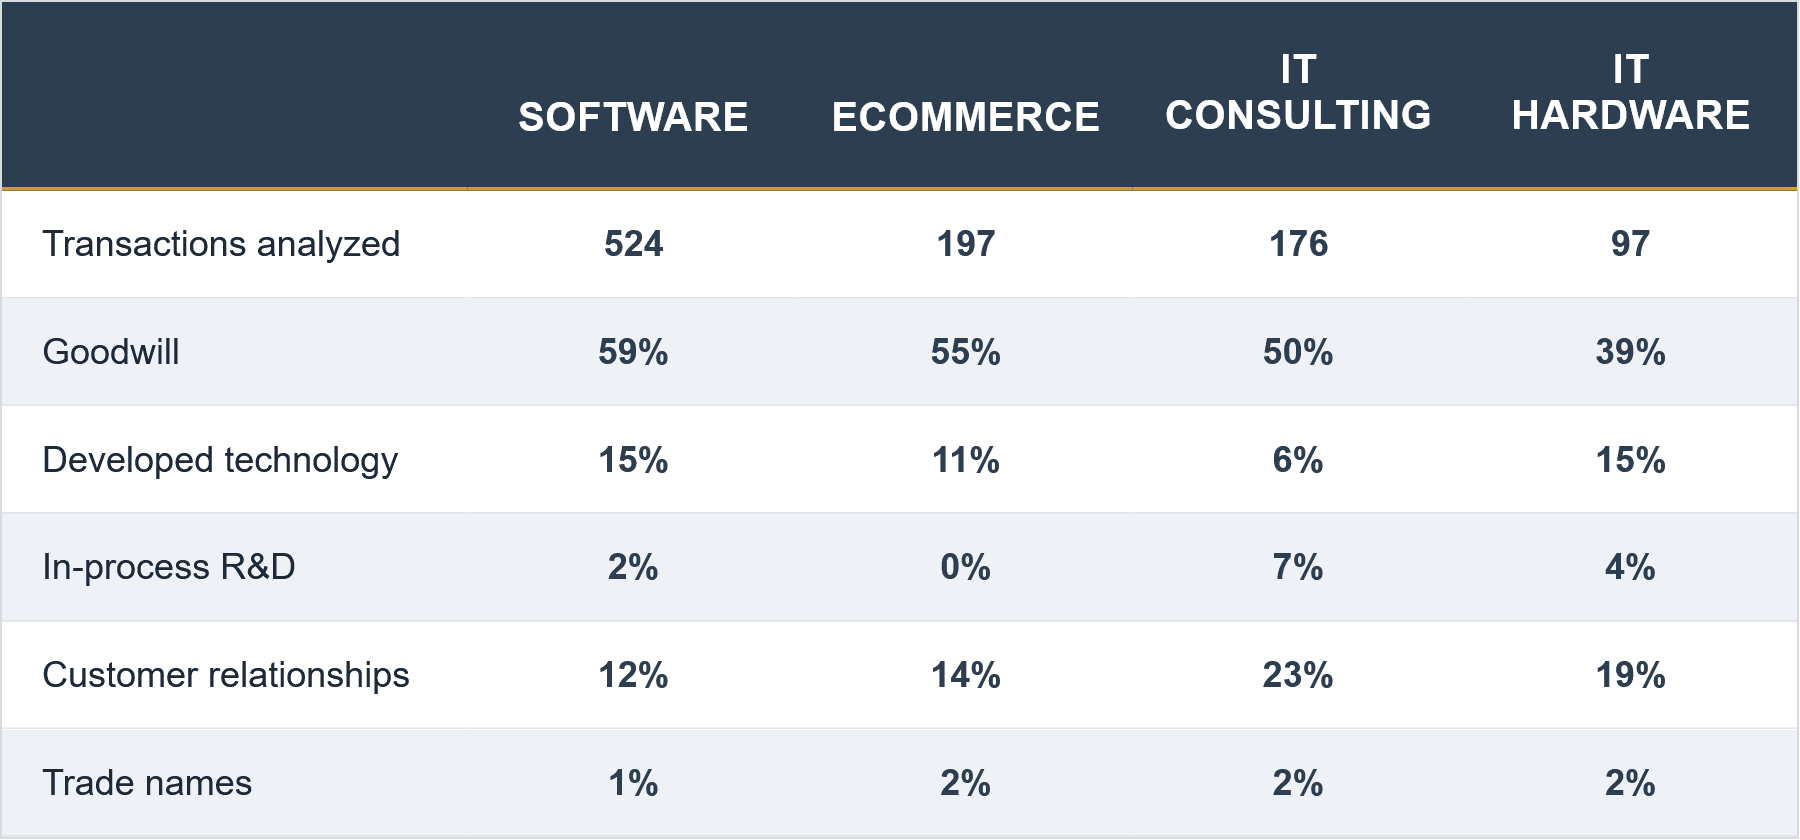 (Percentage of Total Assets Acquired)
Benchmarking by Identified Intangibles
A PPA allocation to a particular intangible will differ depending on which other intangible assets were identified. Below, note how the software industry allocations to developed technology and in-process R&D depend on whether a customer relationship asset is present. Significant differences arise depending on whether acquired companies had identifiable customer relationships.
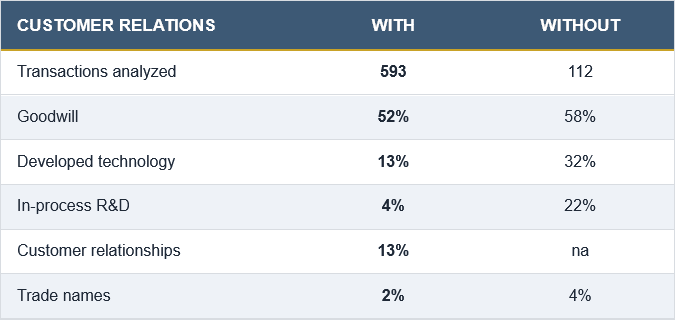 (Percentage of Total Assets Acquired)
Benchmarking Useful Lives
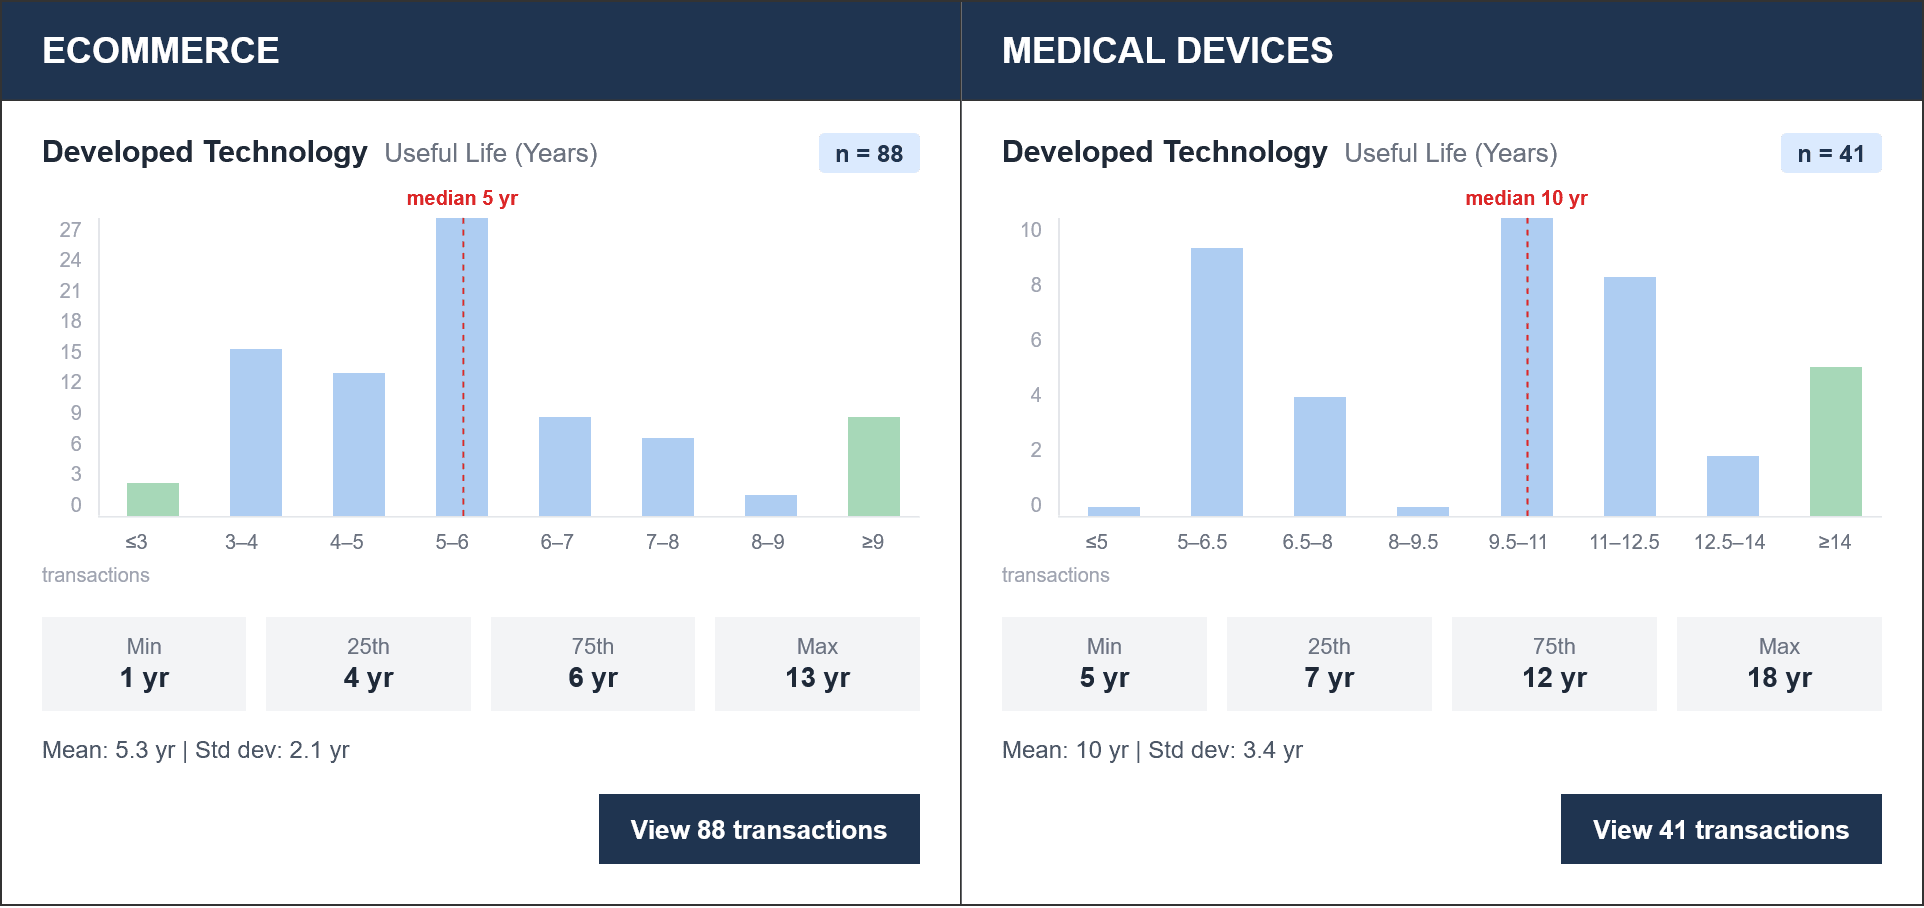
Useful lives of intangible assets can also be benchmarked. In fact, this benchmarking can be the primary source of useful life assumptions. Too often, they are extremely hard to estimate. Consider the useful life of a trade mark of a niche consumer product or B2B software. Quantitative data for such assumptions is often limited.
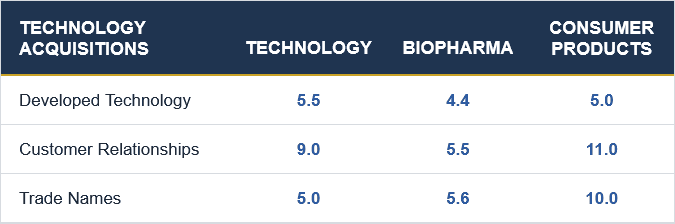 (Years)
Benchmarking Reliability
Finally, results can vary significantly, and their distribution is not bell-curved. Static PPA studies often fail to report benchmark reliability. In fact, the median may be based on two distinct clusters and not representative of an expected value. Consider the differences in the customer relationships underlying the data.
Conclusion
PPA benchmarking is the only alternative sanity-check for complex valuation reports. While static benchmarking studies exist from various sources, allocations depend on more factors than just an industry category. Business model, identified intangibles, and useful lives must all be controlled when developing appropriate benchmarks. Median estimates can also be highly misleading. Both a highly customized set of comparables and the values that comprise it are critical to reaching the right conclusion. A dynamic, customizable tool such as bench805.com is key to meaningful benchmarking.