 Market multiples are popular in business valuation. They are intuitive and easy to apply. From water-cooler to fancy investment conferences, market multiples seem to distill the essence of most complex businesses to a simple multiplication:
Market Multiple x Financial Measure = Valuation
Market multiple is a multiplier that turns a financial measure, can be any measure, into business valuation. Revenue multiple of 3.0x means that a $1.0Bn revenue company is worth $3.0Bn. Simple enough, as long as one can determine:
- Where 3.0x comes from? (usually comparable companies or transactions, a.k.a. comparables)
- How comparable are the comparables? How many of them do we need? (quality beats quantity)
- For comparable transactions, how old can they be? Should the multiples correlate to the broader market?
- How much reliance should be placed on different multiples, e.g. EBITDA, or EBIT, or Gross Margin, or Book Value multiples?
- Do multiples change with company size?
- Should the multiple be applied to historical, projected, or trailing financials?
- How to estimate multiples when business does not have direct peers?
- And so on …..
Careful answers to these questions may turn 3.0x into 10.0x or 1.0x.
If one suspects that we are complicating things unnecessarily, consider Tyson Food that currently carries 0.8x revenue multiple and Beyond Meat with 22.0x revenue multiple. A third food company may be somewhere in between, making selecting a specific revenue multiple highly subjective.
Factors That Drive Market Multiples
A valuation analyst is always faced with a range of potential multiples, often for a number of different financial measures (e.g. revenue, gross profit, EBITDA, EBIT, or book value). In turn, financials can be those from prior, current, or foretasted time periods. Some multiples are more reliable than others depending on how they are derived, how much or how clean the data used to derive them.
For example, EBITDA measurements for two companies may not be consistent if one grows through acquisitions and the other one grows organically. This is because EBITDA ignores intangible asset amortization expense and avoids expensing true costs of building the company, thus overstating its profitability. In such situations, EBIT multiple would be preferred, or better yet, the multiples would be derived based on the peers that pursue similar growth strategy.
In selecting a proper mix of multiples, it is instructive to understand that market approach is a shortcut. Fundamentally, the value of anything is based on expected future cash flows. Market approach skips the complexity of financial forecast-based income approach.
The greater future cash flows will come from companies that are more profitable or grow faster. There, valuation analysts tend to assign greater multiples. Conversely, well-established, less-exciting companies may command higher multiples as the steady cash flows are also less risky. Predictable cash-flows require less discounting in the Discounted Cash Flow (“DCF”) model.
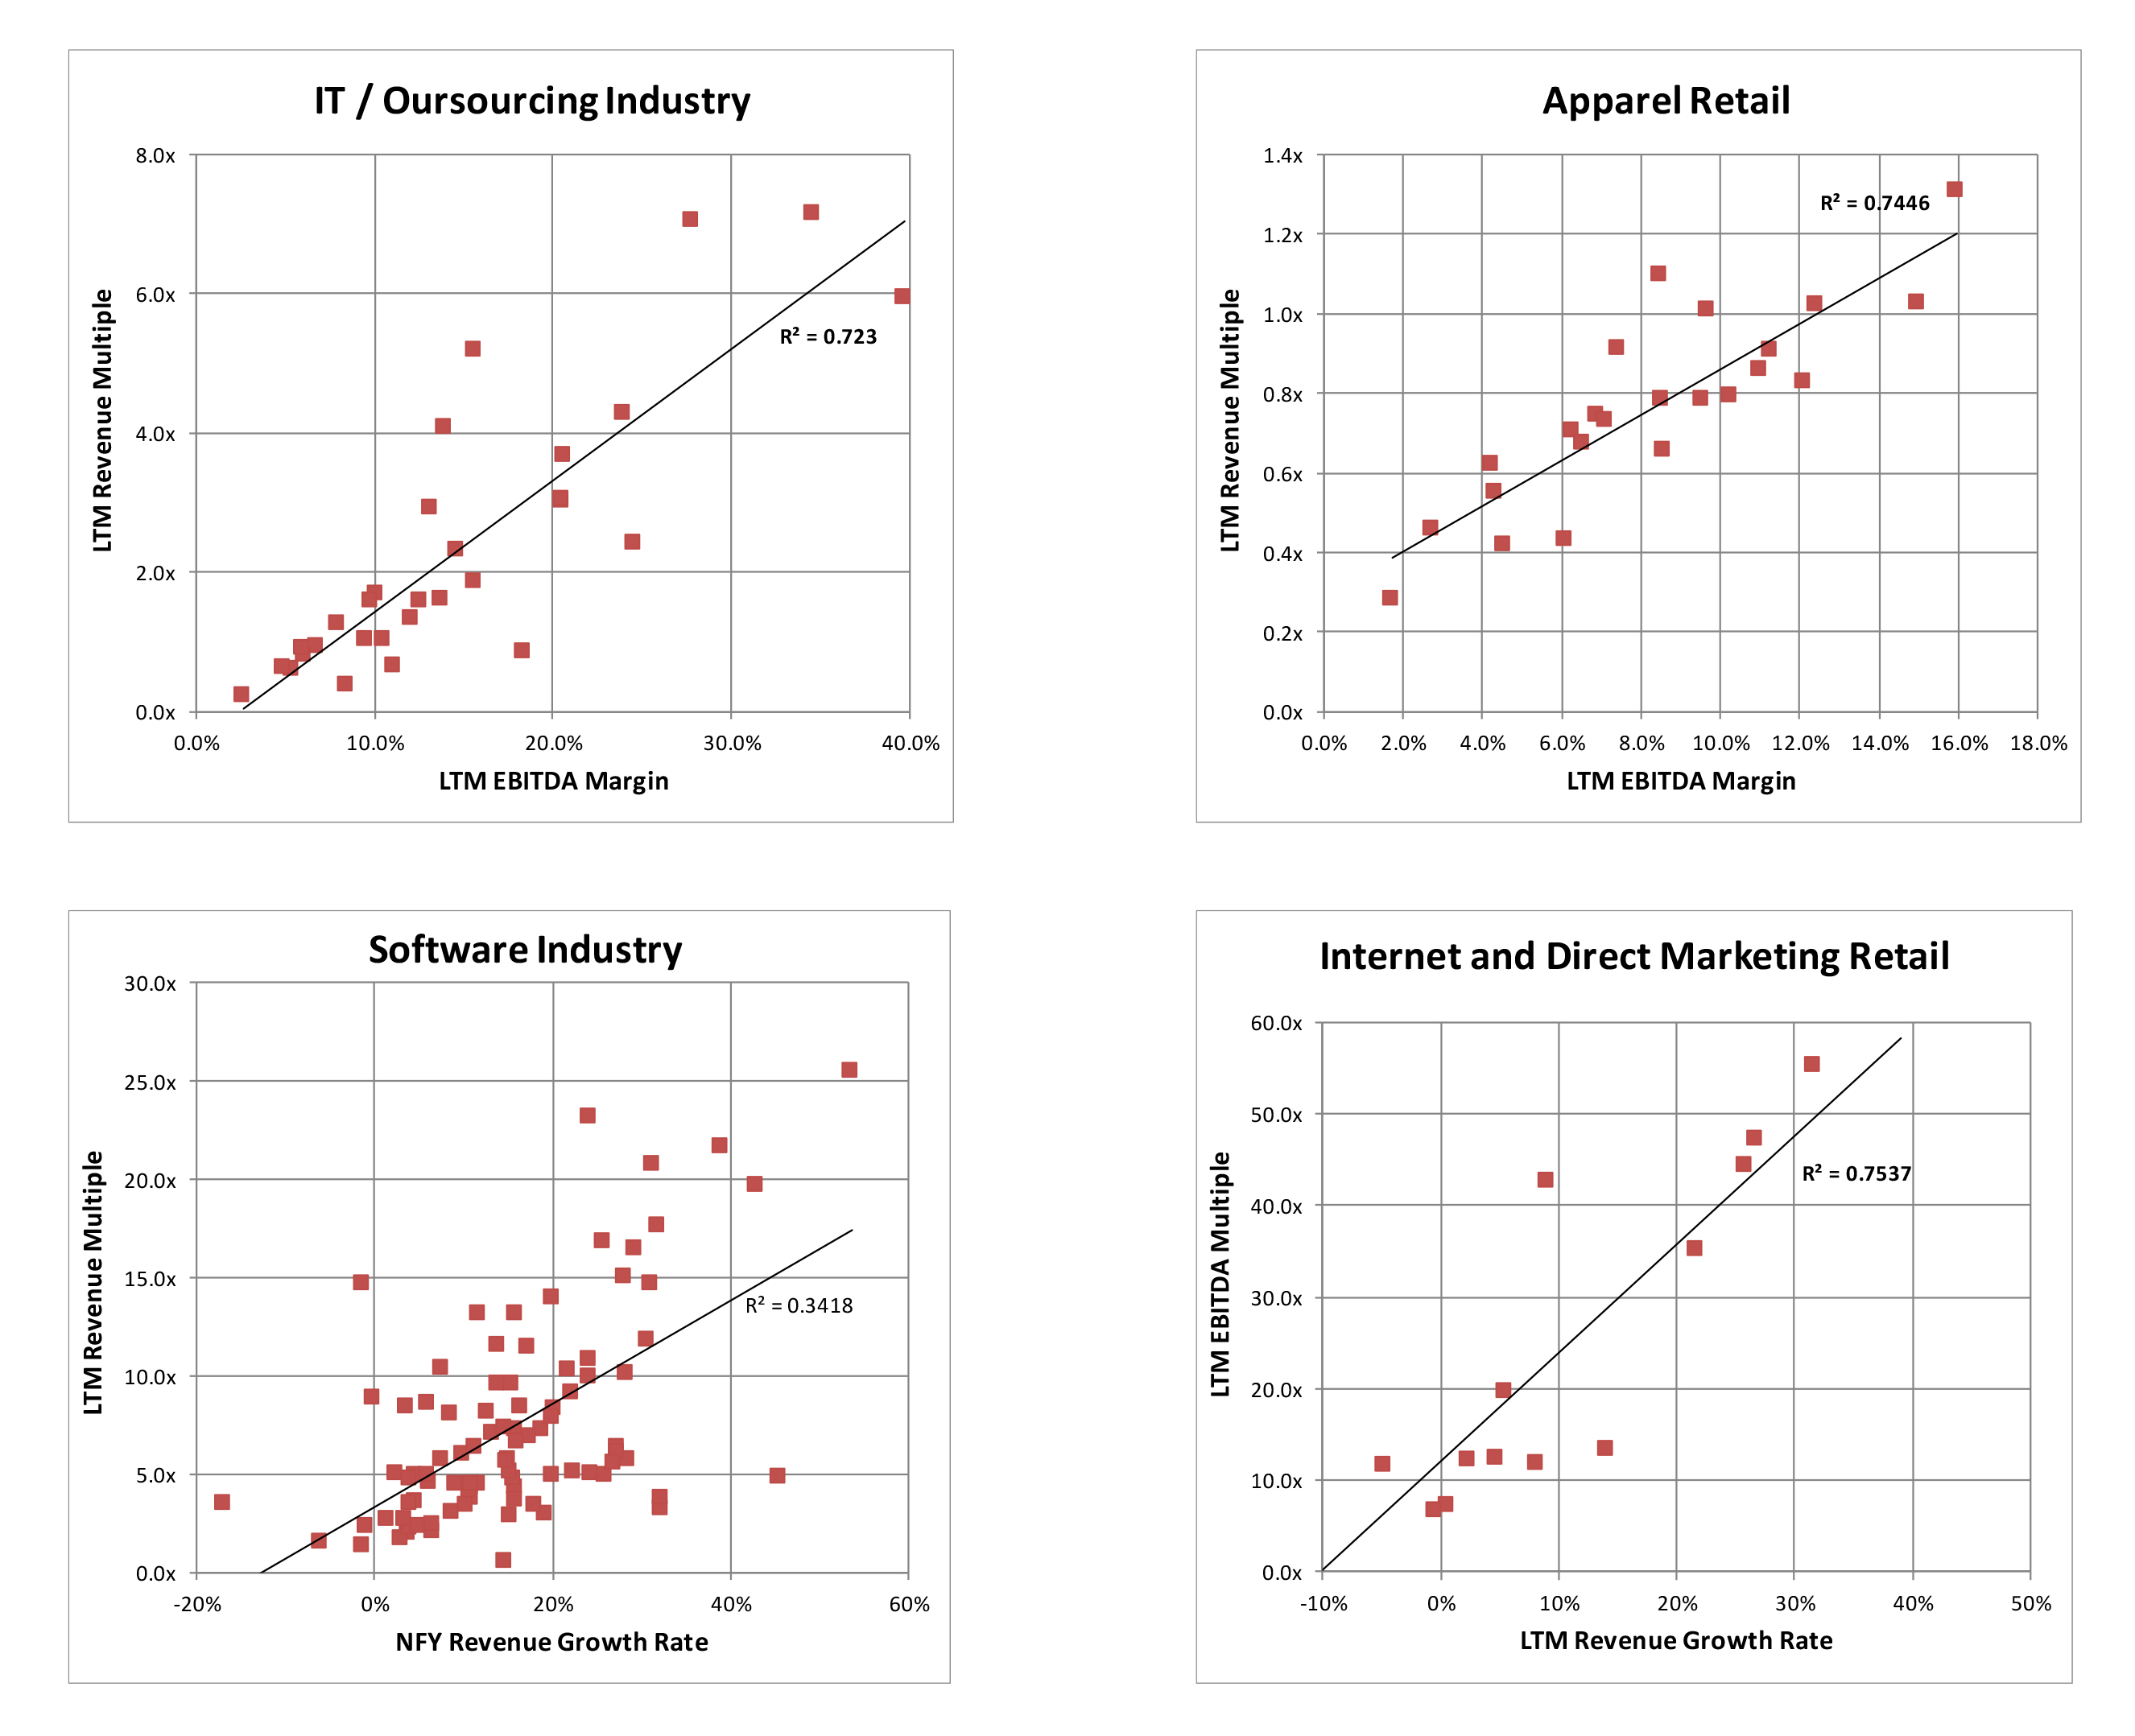
It is often not clear what factors are more impactful. One quantitative approach relies on industry specific correlation analysis to identify what investors are really willing to pay for. Is it revenue or EBIT; past or future performance; predictability or opportunity?
Below are just some of the better correlations we found within information technology and consumer product industries. Feel free to reach out if you don’t find your industry of interest.
R2 is the measure of how good these correlations are; the closer to 1.0 the better. LTM stands for Last Twelve Months, NFY stands for Next Fiscal Year (or current fiscal year). Industry classifications and financial information is provided by CapitalIQ.
Conclusion
While handy in a quick conversation, market approach to valuing businesses can be complex and subjective. The range of peer multiples can span orders of magnitude. Rooted in financial data analytics, the approach requires numerous inputs, estimated and weighted based on highly subjective assumptions. DCF method of the income approach is often necessary to check market multiples for reasonableness (and vice versa).