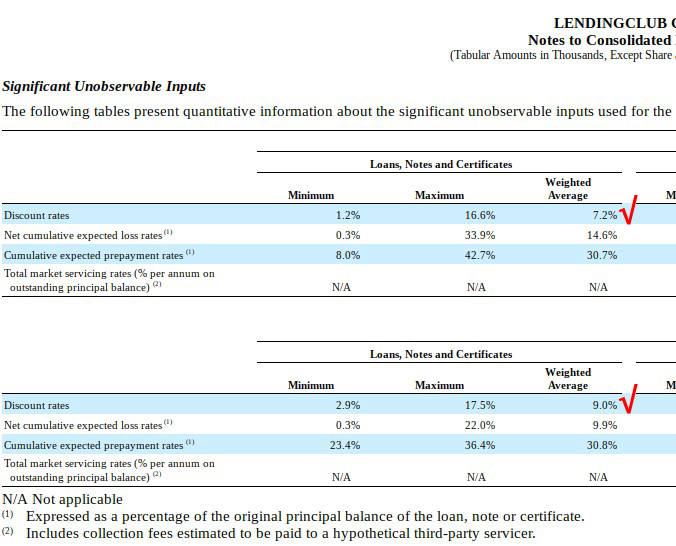
Buried deep in the LendingClub financial statements is a curious number. 7.2% is the investment return LendingClub believes their loans should earn for their investors. The 2016 return estimate, the weighted average across all loan grades, is down from 9.0% reported for 2015, presumably due to greater projected losses. It is consistent with the investment returns reported by other asset classes.
This is from the most recent 10-k filing: (p.107)
Investment returns are hard to come by. They are either highly proprietary, expensive to calculate or non-existent as investors are often sold a “story” rather than data. Definitive investment returns can only come from calculations for a group of loans, aka vintages, that completed all scheduled and expected payments. For example, investment return on 36-month loans originated in Q3 2017 won’t be known until Q4 2020.
Alternative measure of returns relies on valuing a portfolio of loans, while in repayment, at the end of each investment reporting period. These are outstanding obligations, valued based on repayment and investment return expectations. This approach is circular since valuation requires estimating investment rate of return to measure investment rate of return.
Valuations of illiquid financial instruments are inherently subjective. Yet, this is the only method of tracking investment performance in existence. Our earlier post illustrates that despite the subjectivity, portfolio valuations can produce highly reliable numbers.
In May 2017, Prosper corrected its investment return calculations. The returns dropped about 2%. The company called it a “glitch.” Note that Prosper provides current yields rather than the actual all-in investment returns. Current yield is calculated by dividing coupon payments by the principal amount outstanding. It ignores changes in the principal balance itself, which makes it vastly inferior to the true investment rate of return measure.
Below are some more examples where lenders disclose their own rate of return estimates:
| Lender | Return | Return Range |
| LendingClub | 7.2% | 1.2% – 16.6% |
| Prosper | 7.3% | 4.0% – 15.9% |
| EZCORP | na | 9.0% – 22.0% |
Correlation between asset classes can be as important as the rates of return themselves. The correlation between marketplace lending credits and traditional asset classes is broadly assumed to be low, making marketplace lending desirable from the portfolio theory perspective. However, correlation cannot be measured without reliable investment return numbers, thus the true correlation is not really known at this point. Once tech-enabled marketplace lenders build robust investment reporting systems, this growing asset class will become even more desirable as a fixed income investment than it is today.
Schedule a free consultation with us by CLICKING HERE.


